
Linear regression is a very simple, powerful tool to predict the future. Especially when directly implemented in sqlite. This article is based on data from my PV system. From which I want to predict three things:
- at what time the PV system starts to generate power,
- when the most power is expected to be generated and
- when the PV system stops again.
These predictions can be useful to plan when to turn on home appliances, and thus use more of the self produced energy and rely less on the grid. I cannot base the prediction on historical data, and due to clouds and shade of nearby trees I cannot derive the prediction from the time the sun rises and sets. So the prediction will be based on the last 30 days of data.
Approach
The linear regression is implemented in sqlite, because, that's where the data is. The python code handling the result can remain very simple, which is a nice side effect. To do this we start simple, and wrap each result in an outer query, which runs over the previous result. So let's implement a linear regression on time series data in sqlite!
Source Data
The source data looks like this:
select TimeStamp,ETotal from spotdata limit 10 offset 2000;
| TimeStamp | ETotal |
|---|---|
| 1598427906 | 16329548 |
| 1598427926 | 16329548 |
| 1598427946 | 16329549 |
| 1598427986 | 16329549 |
| 1598428006 | 16329550 |
| 1598428026 | 16329550 |
A timestamp and an ever increasing counter.
Relying heavy on sql windows functions we transform this into a input for our regression. This table will be referred to as input in the rest to this article.
| day | start | max | end | count |
|---|---|---|---|---|
| 1 | 28970 | 51420 | 51441 | 1 |
| 2 | 26179 | 33600 | 52499 | 1 |
| ... data omitted for readability ... | ||||
| 29 | 31660 | 34860 | 53043 | 1 |
| 30 | 31121 | 68580 | 68629 | 1 |
Here we see for the last 30 days at which time on that day the energy production:
- started,
- reached it's maximum and
- stopped.
The last 'count' column only exists as an artefact and will be omitted. The time is counted in seconds from the start of the day at midnight.
Linear Regression
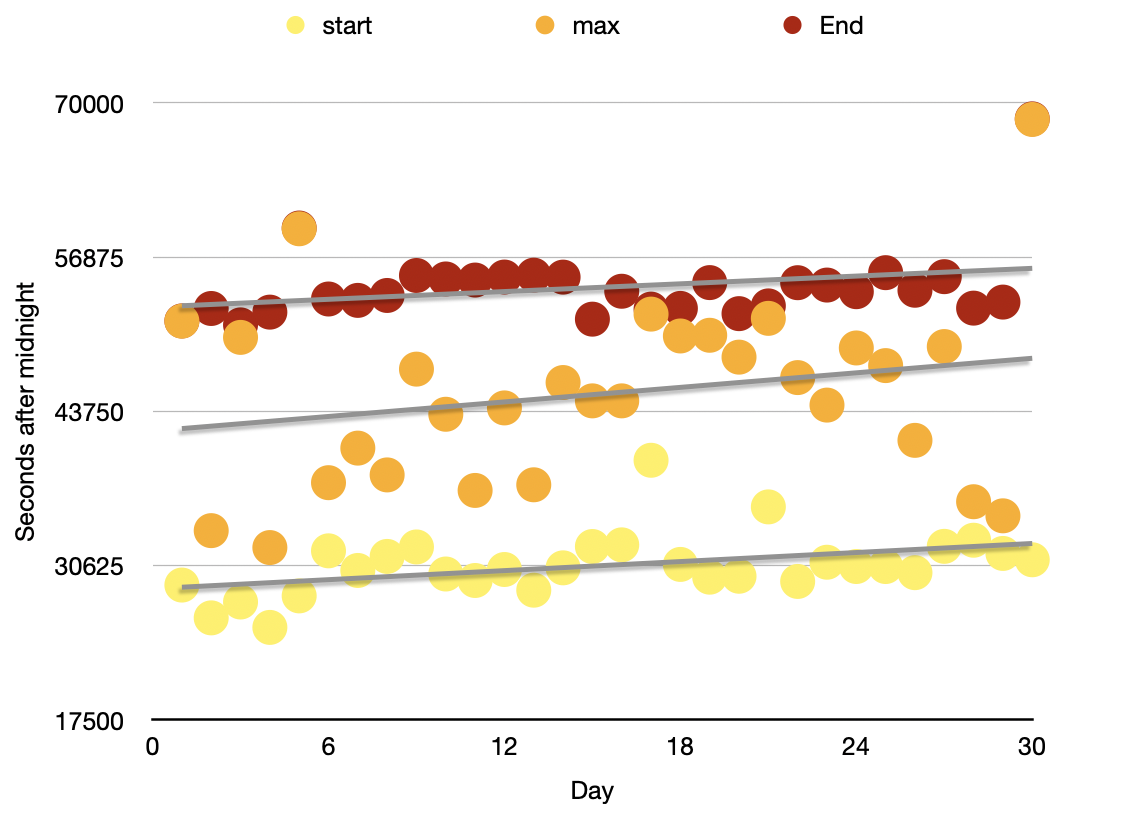
This image shows what I want to achieve. The linear regression for each series is overlaid in gray. This way I can extend the regression line and predict the values for the current day and tomorrow.
As you can see, a linear regression is the best fitting line for the series. Best fitting means the total distance of all point to the line is minimized.
Definition
The equation can be found in any statistical analytics text book:
y=m∙x+b
Where m is called the slope which determines the direction of the line and b is called the intercept which defines the distance of the line from 0.
m is calculated:
m=∑(xi - ẍ)(yi - ÿ) / ∑(xi - ẍ)2
and b is calculated using m :
b=max y - max x ∙ m
Where ẍ and ÿ are the averages of x and y.
Slope
First we calculate (xi - ẍ)(yi - ÿ). We do this by using the window function for avg. This adds the average to the each row in the result set:
select
	day, avg(day) over () as day_bar,
	start, avg(start) over () as start_bar,
	max, avg(max) over () as max_bar,
	end, avg(end) over () as end_bar
from input
| day | day_bar | start | start_bar | max | max_bar | end | end_bar |
|---|---|---|---|---|---|---|---|
| 1 | 15.5 | 28970 | 30647.0 | 51420 | 45272.0 | 51441 | 54322.8 |
| 2 | 15.5 | 26179 | 30647.0 | 33600 | 45272.0 | 52499 | 54322.8 |
| 3 | 15.5 | 27529 | 30647.0 | 50040 | 45272.0 | 51102 | 54322.8 |
| ... | ... | ... | ... | ... | ... | ... | ... |
Next we add the summaries as follows to calculate the slope:
select
	sum((day - day_bar) * (start - start_bar)) /
		sum((day - day_bar) * (day - day_bar)) as start_slope,
	sum((day - day_bar) * (max - max_bar)) /
		sum((day - day_bar) * (day - day_bar)) as max_slope,
	sum((day - day_bar) * (end - end_bar)) /
		sum((day - day_bar) * (day - day_bar)) as end_slope
from (
	<previous query omitted for readability>
)
| start_slope | max_slope | end_slope |
|---|---|---|
| 128.292324805339 | 206.255839822024 | 109.764627363737 |
Intercept
With the slope we can calculate the intercept.
b=max y - max x ∙ m
As you can see in the equation, we also need the max in the previous query.
select
	start_slope,
	start_bar_max - day_bar_max * start_slope as start_intercept,
	max_slope,
	max_bar_max - day_bar_max * max_slope as max_intercept,
	end_slope,
	end_bar_max - day_bar_max * end_slope as end_intercept
from (
select
	sum((day - day_bar) * (start - start_bar)) /
		sum((day - day_bar) * (day - day_bar)) as start_slope,
	sum((day - day_bar) * (max - max_bar)) /
		sum((day - day_bar) * (day - day_bar)) as max_slope,
	sum((day - day_bar) * (end - end_bar)) /
		sum((day - day_bar) * (day - day_bar)) as end_slope,
	max(day_bar) as day_bar_max,
	max(start_bar) as start_bar_max,
	max(max_bar) as max_bar_max,
	max(end_bar) as end_bar_max
from (
	<previous query omitted for readability>
| start_slope | start_intercept | max_slope | max_intercept | end_slope | end_intercept |
|---|---|---|---|---|---|
| 128.292324805339 | 28658.4689655172 | 206.255839822024 | 42075.0344827586 | 109.764627363737 | 52621.4482758621 |
Predict the future!
With the slope and intercept for each series it's trivial to calculate the prediction for today or tomorrow. The example uses 30 days history, so tomorrow is the 31st day.
We add the following outer query to the query from above:
select
	time(start_slope * 31 + start_intercept, 'unixepoch', 'localtime')
	as start_time,
	time(max_slope * 31 + max_intercept, 'unixepoch', 'localtime')
	as max_time,
	time(end_slope * 31 + end_intercept, 'unixepoch', 'localtime')
	as end_time
from (
	<previous query omitted for readability>
)
And here is our prediction:
| start_time | max_time | end_time |
|---|---|---|
| 09:03:55 | 13:27:48 | 15:33:44 |
The result of an linear integration, over time series data, right in sqlite! The result is ready to be used in any control or visualization.
To conclude, the complete query:
select
	time(start_slope * 31 + start_intercept, 'unixepoch', 'localtime') as start_time,
	time(max_slope * 31 + max_intercept, 'unixepoch', 'localtime') as max_time,
	time(end_slope * 31 + end_intercept, 'unixepoch', 'localtime') as end_time
from (

select
	start_slope,
	start_bar_max - day_bar_max * start_slope as start_intercept,
	max_slope,
	max_bar_max - day_bar_max * max_slope as max_intercept,
	end_slope,
	end_bar_max - day_bar_max * end_slope as end_intercept
from(

select
	sum((day - day_bar) * (start - start_bar)) / sum((day - day_bar) * (day - day_bar)) as start_slope,
	sum((day - day_bar) * (max - max_bar)) / sum((day - day_bar) * (day - day_bar)) as max_slope,
	sum((day - day_bar) * (end - end_bar)) / sum((day - day_bar) * (day - day_bar)) as end_slope,
	max(day_bar) as day_bar_max,
	max(start_bar) as start_bar_max,
	max(max_bar) as max_bar_max,
	max(end_bar) as end_bar_max
from (

select
	day, avg(day) over () as day_bar,
	start, avg(start) over () as start_bar,
	max, avg(max) over () as max_bar,
	end, avg(end) over () as end_bar
from input
)
)
)

I am Erwin Vrolijk. A technologist, living in Dordrecht, The Netherlands, with a varied talent stack. I help people to be more effective based on data. Learn more about me.