
Data Persistence in the OpenTelemetry Collector
2023 January 18 - 744 words - 4 mins - opentelemetry open source blogWhat happens if the OpenTelemetry collector cannot send data? Will it drop, queue in memory or on disk? Let's find out which settings are available and how they work!
To check how queuing works, I've set up a small test environment. This environment consists of several data sources (postgresql, collectd and prometheus) a opentelemetry collector and a Splunk enterprise as destination.
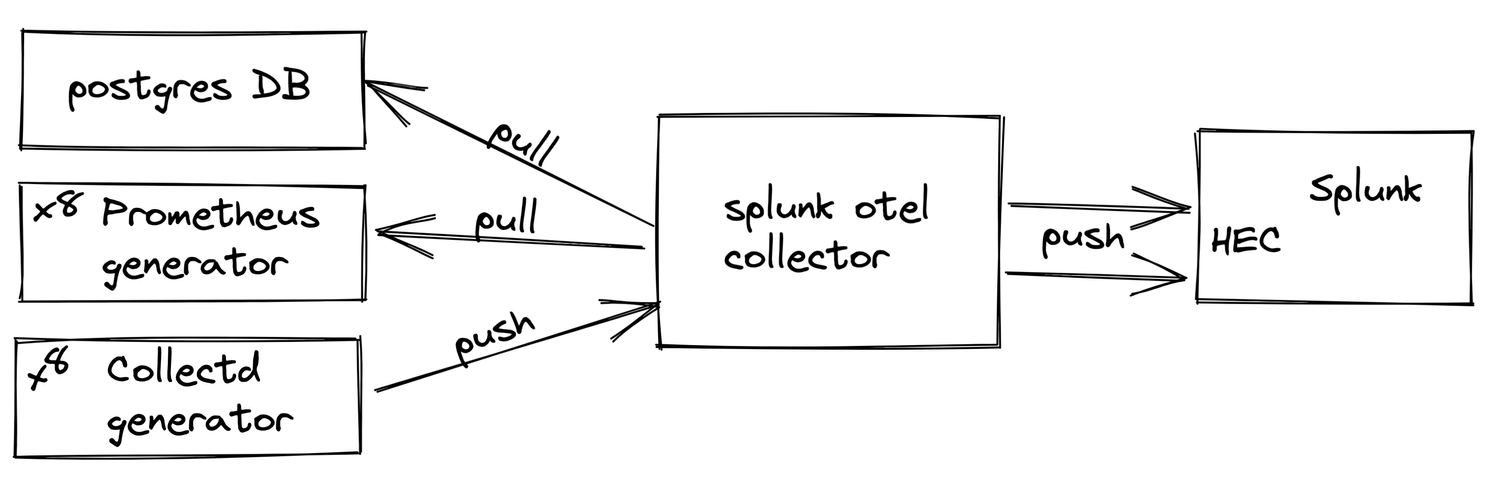
All collected data is sent to Splunk via one HEC endpoint. All internal metrics of the otel collector are sent to Splunk via another HEC endpoint.
This test environment, including all example configurations can be found at my Splunk GitHub.
I will test the queueing of the otel collector by temporarily disabling the HEC endpoint which receives the collected metrics. Via the other HEC endpoint I will still receive the internal metrics, so we can see what's going on with the collector while it cannot send metrics.
Queueing in the OpenTelemetry Collector
Queueing is implemented in most exporters via the exporterhelper. These settings can at least be used in all exporters relevant for Splunk, sapm, splunkhec. For other exporters please check the documentation or the implementation of these exporters.
Settings for queueing are thus set per exporter in the collector.yaml file. We have two types of queues available which I will be using together:
In Memory Queue
By default, without any configuration, data is queued in memory only. When data cannot be sent it is retried a few times (up to 5 mins. by default) and then dropped.
If for any reason, the collector is restarted in this period, the queued data will be gone.
If you can accept this type of data loss, you can keep the defaults or tune the queue size in collector.yaml for each exporter like this:
sending_queue
    queue_size # (default = 5000): Maximum number of batches kept in memory before dropping.
      # User should calculate this as num_seconds * requests_per_second / requests_per_batch
      # where:
      #  num_seconds is the number of seconds to buffer in case of a backend outage
      #  requests_per_second is the average number of requests per seconds
      #  requests_per_batch is the average number of requests per batch
      #  (if the batch processor is used, the metric batch_send_size can be used for estimation)
On Disk Persistant Queue
This queue is stored to the disk, so it will persist, even when the collector is restarted. On restart the queue will be picked up and exporting is restarted.
Testing Queueing out
In my example test environment, I've set up the metrics HEC exporter to use a persistent queue which is stored on disk using the filestorage extension.
From my collector.yaml:
extensions:
  file_storage/psq:
     directory: /persistant_sending_queue
     timeout: 10s # in what time a file lock should be obtained
     compaction:
       directory: /persistant_sending_queue
       on_start: true
       on_rebound: true
       rebound_needed_threshold_mib: 5
       rebound_trigger_threshold_mib: 3
I put the persistent queue on disk in the directory called /persistant_sending_queue.
For the test, I've set some very small limits on the size of the queue on disk, 3mb and 5mb as triggers for compaction.
I've also configured my splunk_hec/metrics exporter to use this queue:
exporters:
  splunk_hec/metrics:
    token: ${SPLUNK_HEC_TOKEN_METRICS}
    endpoint: ${SPLUNK_HEC_URL}
    source: otel
    sourcetype: otel
    index: "metrics"
    max_connections: 20
    disable_compression: false
    timeout: 10s
    tls:
      insecure_skip_verify: true
    retry_on_failure:
      enabled: true
      initial_interval: 1s
      max_interval: 300s
      max_elapsed_time: 120s
    sending_queue:
      storage: file_storage/psq
What Happens When Data Cannot be Output?
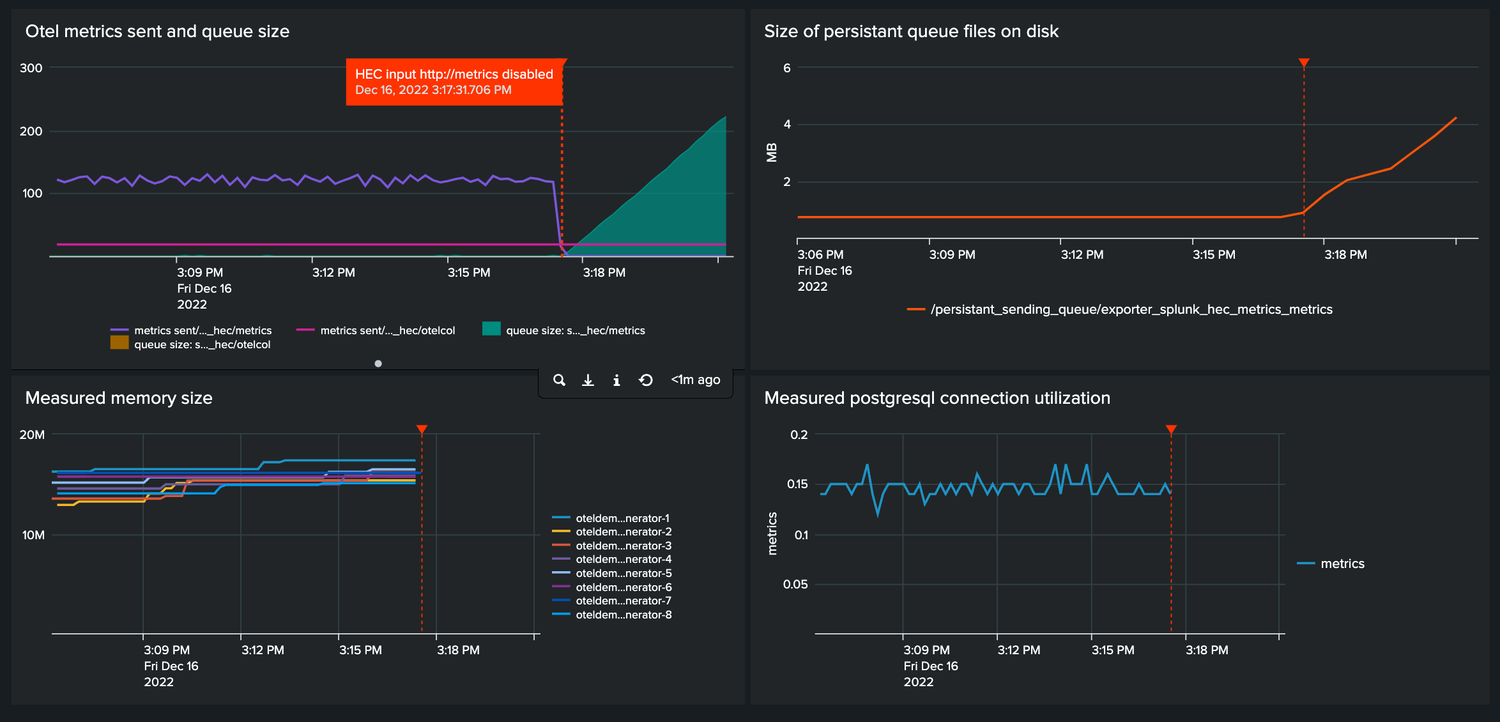 When I disable the metrics HEC input we see the following happens:
- data is queued
- data is persisted to the disk
- no metrics are being received
What Happens When the Connection is Restored?
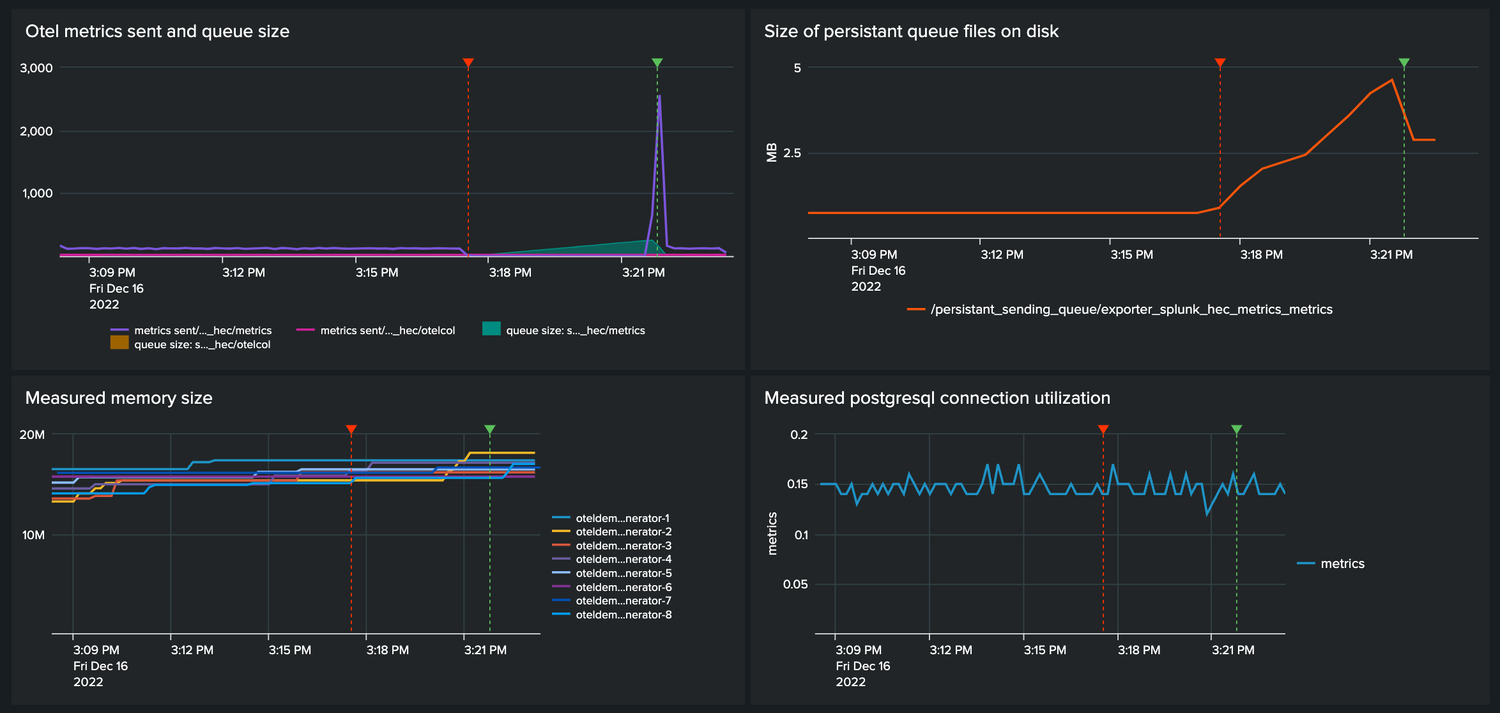 When the metrics HEC endpoint is enabled again (see green annotation) we see the following happens:
- queue is drained
- persistent queue size on disk is slightly reduced
- metric data from the past is filled in, no gaps remain
Even though the queue is completely drained, the on-disk persistent queue has not reduced in size much. As we didn't hit the configured high water mark of 5mb for the on-disk queue, compaction is not started. We did go below the low water mark of 3mb. This means the next time we go above 5 mb and flush the queue compaction will happen.
Test Compaction
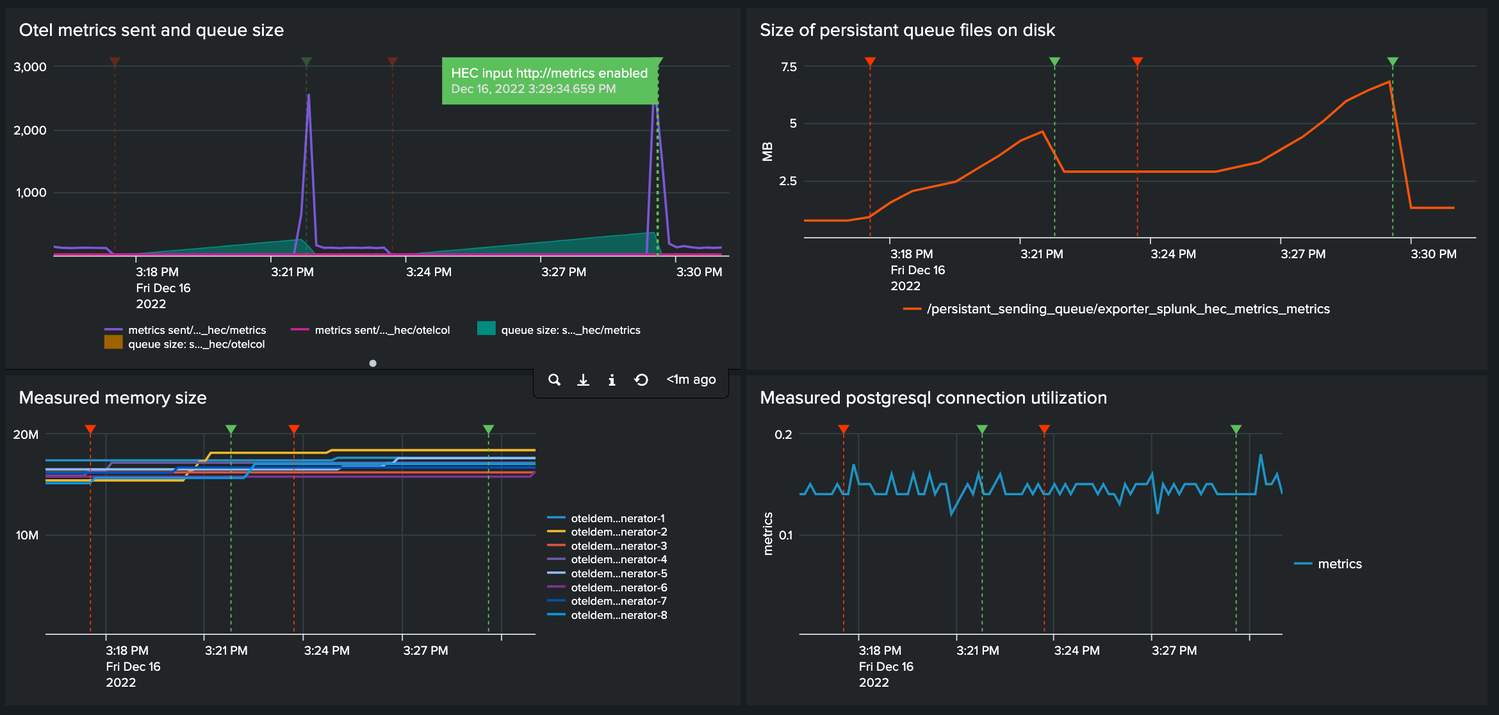 I ran the same experiment again. Let the queue fill up and enable the HEC endpoint again to flush the queue. This time I went above the high water mark of 5mb and we see the on-disk file size is reduced as it should be.
Considerations When Scaling up
Be very mindful of your queue sizes. sending_queue.queue_size controls how much memory or disk space will be used before the collector will drop data. This value is set for each exporter, so to determine the sizing of the exporter all values should be added together.
This article was originally written for and published as a Splunk Community Blog

I am Erwin Vrolijk. A technologist, living in Dordrecht, The Netherlands, with a varied talent stack. I help people to be more effective based on data. Learn more about me.