
Use OpenTelemetry to Auto Instrument WordPress
2022 November 01 - 1449 words - 8 mins - opentelemetry open source blogOpenTelemetry is often associated with modern microservices and cloud-native applications. What happens if we apply OpenTelemetry and modern observability techniques to something completely different? WordPress is the world's most popular weblog software. And it's also an almost 20 years old monolith. What happens if we use OpenTelemetry auto instrumentation and the Splunk Observability cloud?
Imagine you are responsible for running WordPress sites. What insights can we bring with modern tools to a popular monolith? Just by instrumenting the environment, without any changes to the WordPress code.
This is exactly what I will show you, please follow along!
Setup
We run WordPress and the accompanying database in docker. We will not modify the WordPress code in any way. We add auto instrumentation to the PHP runtime as a module. We send the metrics and traces to Splunk APM.
If you want to dive in directly, all code shown in this blog can be found in my WordPress Auto Instrument repo.
Add auto instrumentation to stock WordPress container image
We use the open-source PHP tracing module to do the tracing. In order to install this we:
- download the latest tracing .tgz
curl -s https://api.github.com/repos/signalfx/signalfx-php-tracing/releases/latest \ | grep browser_download_url \ | grep signalfx-tracing.tar.gz \ | cut -d '"' -f 4 \ | xargs curl > signalfx-tracing.tar.gz - Create a Dockerfile to build our own WordPress with tracing added:
FROM wordpress:php7.4

COPY $PWD/signalfx-tracing.tar.gz /tmp
RUN tar -xf /tmp/signalfx-tracing.tar.gz -C / && /opt/signalfx-php-tracing/bin/post-install.sh
Configure local environment
We add (sensitive) environment variables to a file called .env It's best to add this file to your .gitignore and .dockerignore.
The SPLUNK_ACCESS_TOKEN and SPLUNK_REALM are specific to your Splunk Observability Cloud account. Get a free trial to try this out for yourself.
MYSQL_ROOT_PASSWORD=your_root_password
MYSQL_USER=your_wordpress_database_user
MYSQL_PASSWORD=your_wordpress_database_password

SIGNALFX_SERVICE_NAME=wordpress
SIGNALFX_ENDPOINT_URL=http://splunk-otel-collector:9411/api/v2/traces

SPLUNK_MEMORY_TOTAL_MIB=1024
SPLUNK_ACCESS_TOKEN=<place your token here>
SPLUNK_REALM=us0
Create docker compose file
We base our docker compose file on the sample provided by docker.
For old times' sake, we use a MySQL image, instead of the default mariadb. And we don't need to expose the database ports, we connect both containers via a dedicated network.
version: '3'

services:
  db:
    image: mysql:8.0
    container_name: db
    restart: always
    env_file: .env
    environment:
      - MYSQL_DATABASE=wordpress
    volumes:
      - dbdata:/var/lib/mysql
    command: '--default-authentication-plugin=mysql_native_password'
    networks:
      - app-network
For WordPress we add a build configuration, so our own Docker file is used to build the container.
This adds our auto instrumentation to the stock WordPress container.
  wordpress:
    depends_on:
      - db
    image: traced-wordpress:latest
    build: ./traced-wordpress
    container_name: wordpress
    restart: always
    env_file: .env
    environment:
      - WORDPRESS_DB_HOST=db:3306
      - WORDPRESS_DB_USER=$MYSQL_USER
      - WORDPRESS_DB_PASSWORD=$MYSQL_PASSWORD
      - WORDPRESS_DB_NAME=wordpress
    volumes:
      - wordpress:/var/www/html
    networks:
      - app-network
    ports:
      - "8080:80"
To collect metrics and traces we also add the Splunk OpenTelemetry collector container.
We provide the configuration for the collector via a bind mounted file: collector.yaml. We will discuss the contents of this file later on.
  splunk-otel-collector:
    image: quay.io/signalfx/splunk-otel-collector:latest
    env_file: .env
    environment:
      - SPLUNK_ACCESS_TOKEN=${SPLUNK_ACCESS_TOKEN}
      - SPLUNK_REALM=${SPLUNK_REALM}
      - SPLUNK_CONFIG=/etc/collector.yaml
    volumes:
      - ./collector.yaml:/etc/collector.yaml
    ports:
      - "13133:13133"
      - "14250:14250"
      - "14268:14268"
      - "4317:4317"
      - "6060:6060"
      - "8888:8888"
      - "9080:9080"
      - "9411:9411"
      - "9943:9943"
      - "23456"
    networks:
      - app-network
To make our WordPress config and extensions and database persistent we need to add volumes. And to enable communication between the containers we add a network:
volumes:
  wordpress:
  dbdata:

networks:
  app-network:
Splunk OpenTelemetry Collector Configuration
We start with a minimal configuration based on the default config of the Splunk Opentelemetry Collector.
extensions:
  smartagent:
    bundleDir: ${SPLUNK_BUNDLE_DIR}
    collectd:
      configDir: ${SPLUNK_COLLECTD_DIR}
  memory_ballast:
    size_in_percentage: 33
receivers:
  zipkin:
    endpoint: 0.0.0.0:9411
  prometheus/internal:
    config:
      scrape_configs:
      - job_name: otel-collector
        scrape_interval: 10s
        static_configs:
        - targets:
          - 0.0.0.0:8888
        metric_relabel_configs:
        - source_labels:
          - __name__
          regex: .*grpc_io.*
          action: drop
  hostmetrics:
    collection_interval: 10s
    scrapers:
      cpu:
      disk:
      filesystem:
      memory:
      network:
      load:
      paging:
      processes:
processors:
  batch:
  memory_limiter:
    check_interval: 2s
    limit_mib: ${SPLUNK_MEMORY_LIMIT_MIB}
  resourcedetection:
    detectors:
    - ec2
    - gce
    - azure
    - ecs
    - system
    override: false
  resourcedetection/internal:
    detectors:
    - ec2
    - gce
    - azure
    - ecs
    - system
    override: true
  resource/add_environment:
    attributes:
    - action: insert
      value: production
      key: deployment.environment
exporters:
  sapm:
    access_token: ${SPLUNK_ACCESS_TOKEN}
    endpoint: ${SPLUNK_TRACE_URL}
  signalfx:
    access_token: ${SPLUNK_ACCESS_TOKEN}
    api_url: ${SPLUNK_API_URL}
    ingest_url: ${SPLUNK_INGEST_URL}
    sync_host_metadata: true
    correlation:
service:
  extensions:
  - memory_ballast
  pipelines:
    metrics:
      receivers:
      - hostmetrics
      processors:
      - memory_limiter
      - batch
      - resourcedetection
      exporters:
      - signalfx
    metrics/internal:
      receivers:
      - prometheus/internal
      processors:
      - memory_limiter
      - batch
      - resourcedetection/internal
      exporters:
      - signalfx
    traces:
      receivers:
      - zipkin
      processors:
      - memory_limiter
      - batch
      - resourcedetection
      - resource/add_environment
      exporters:
      - sapm
      - signalfx
To be able to identify this installation, we update the deployment.environment to uniquely identify this WordPress installation. In our case we remove production and set it to wordpress, by updating the value in this processor:
  resource/add_environment:
    attributes:
      - action: insert
        value: wordpress
        key: deployment.environment
First start
To prepare our environment we run make. This will download the PHP auto tracing library, and build our custom WordPress container.
We can start our environment:
% docker-compose up
When we open our browser to http://localhost:8080/ we are greeted with the WordPress installer.
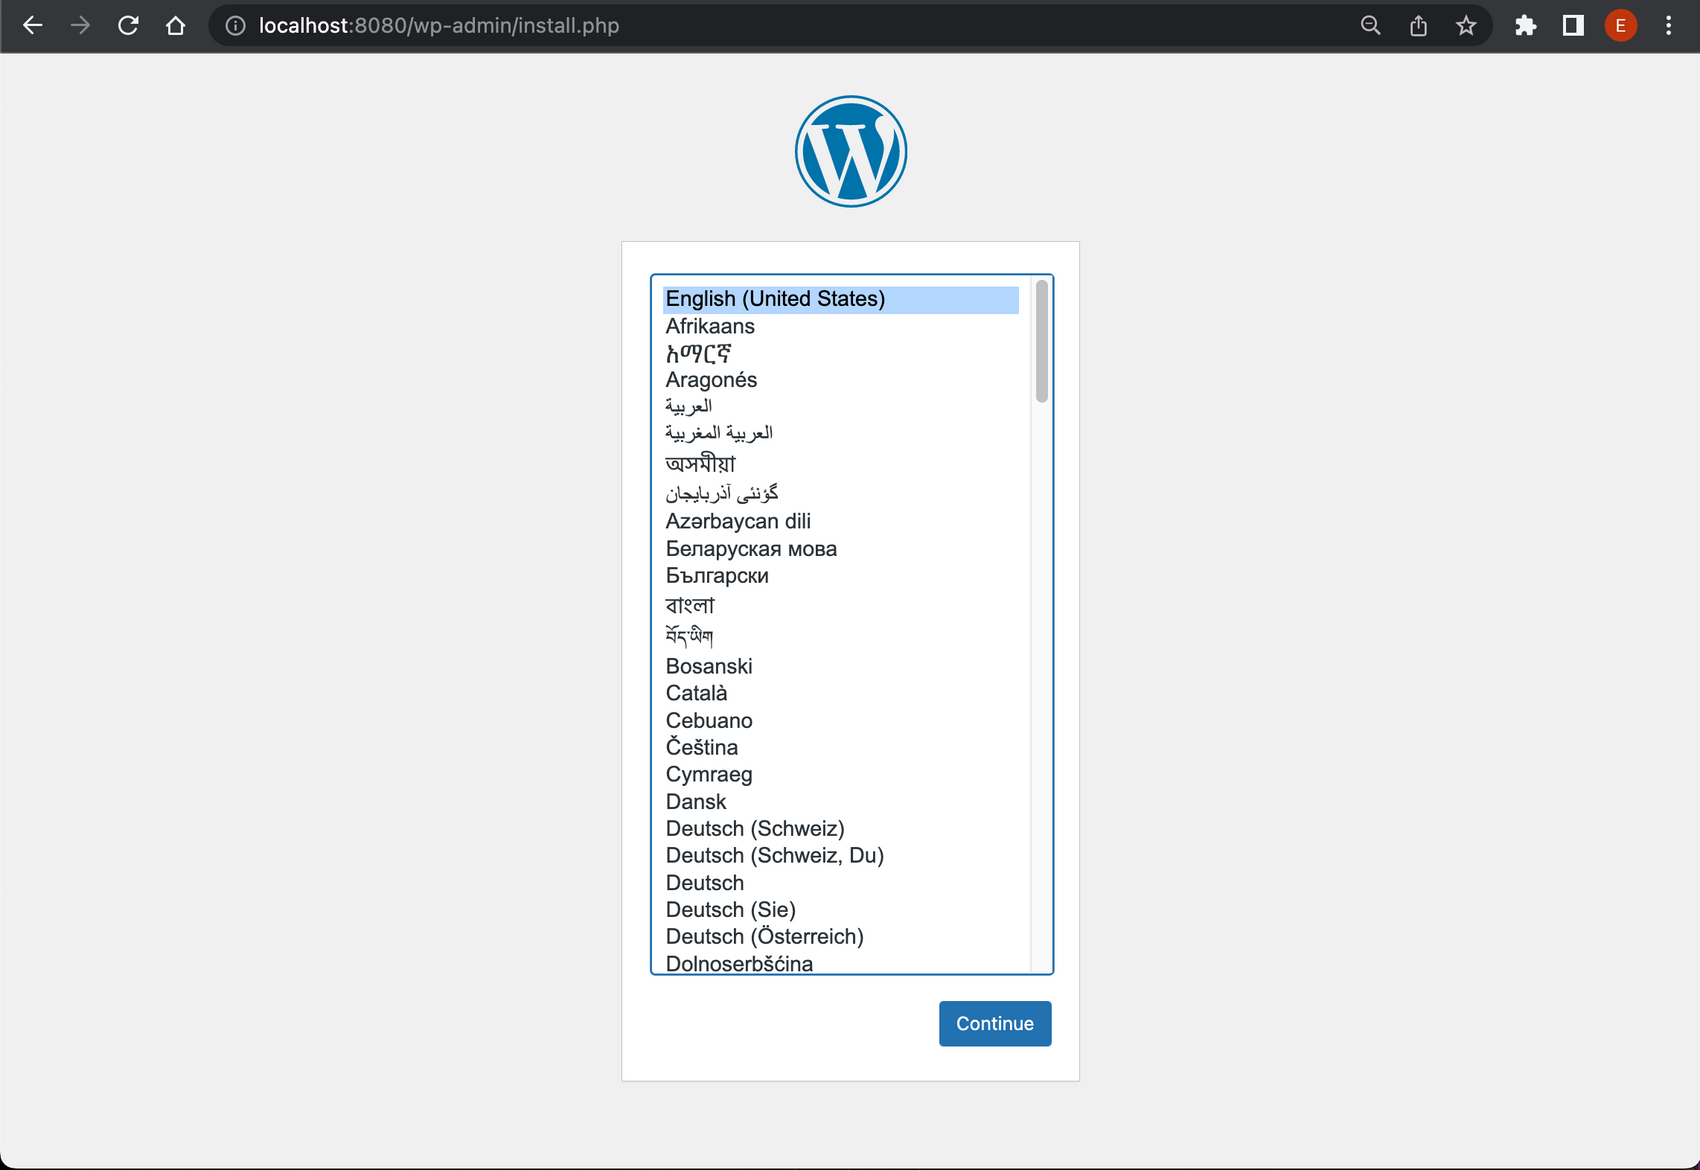 We follow the installer, and add some default configurations. When done we log in using the credentials created in the previous step. We don't like the default URL scheme so we change it to
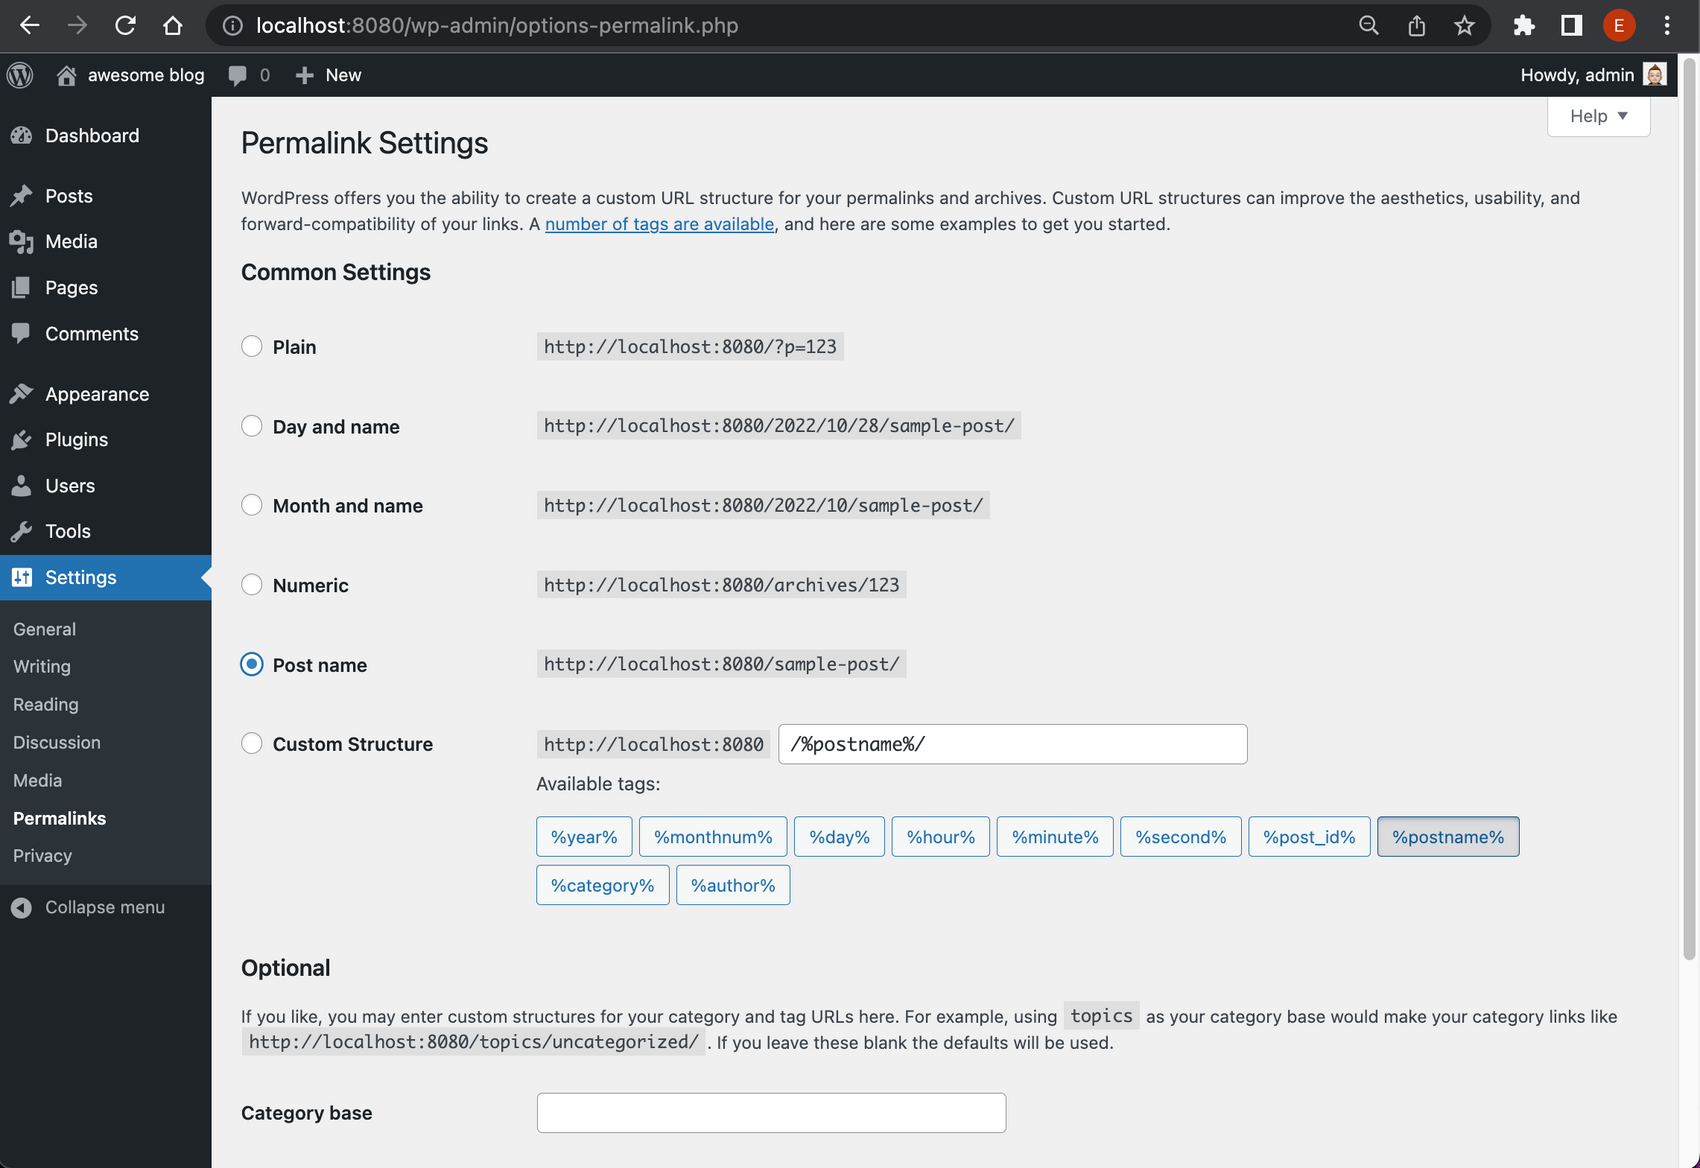
 postname. Navigate to:
Administration -> Settings -> Permalinks
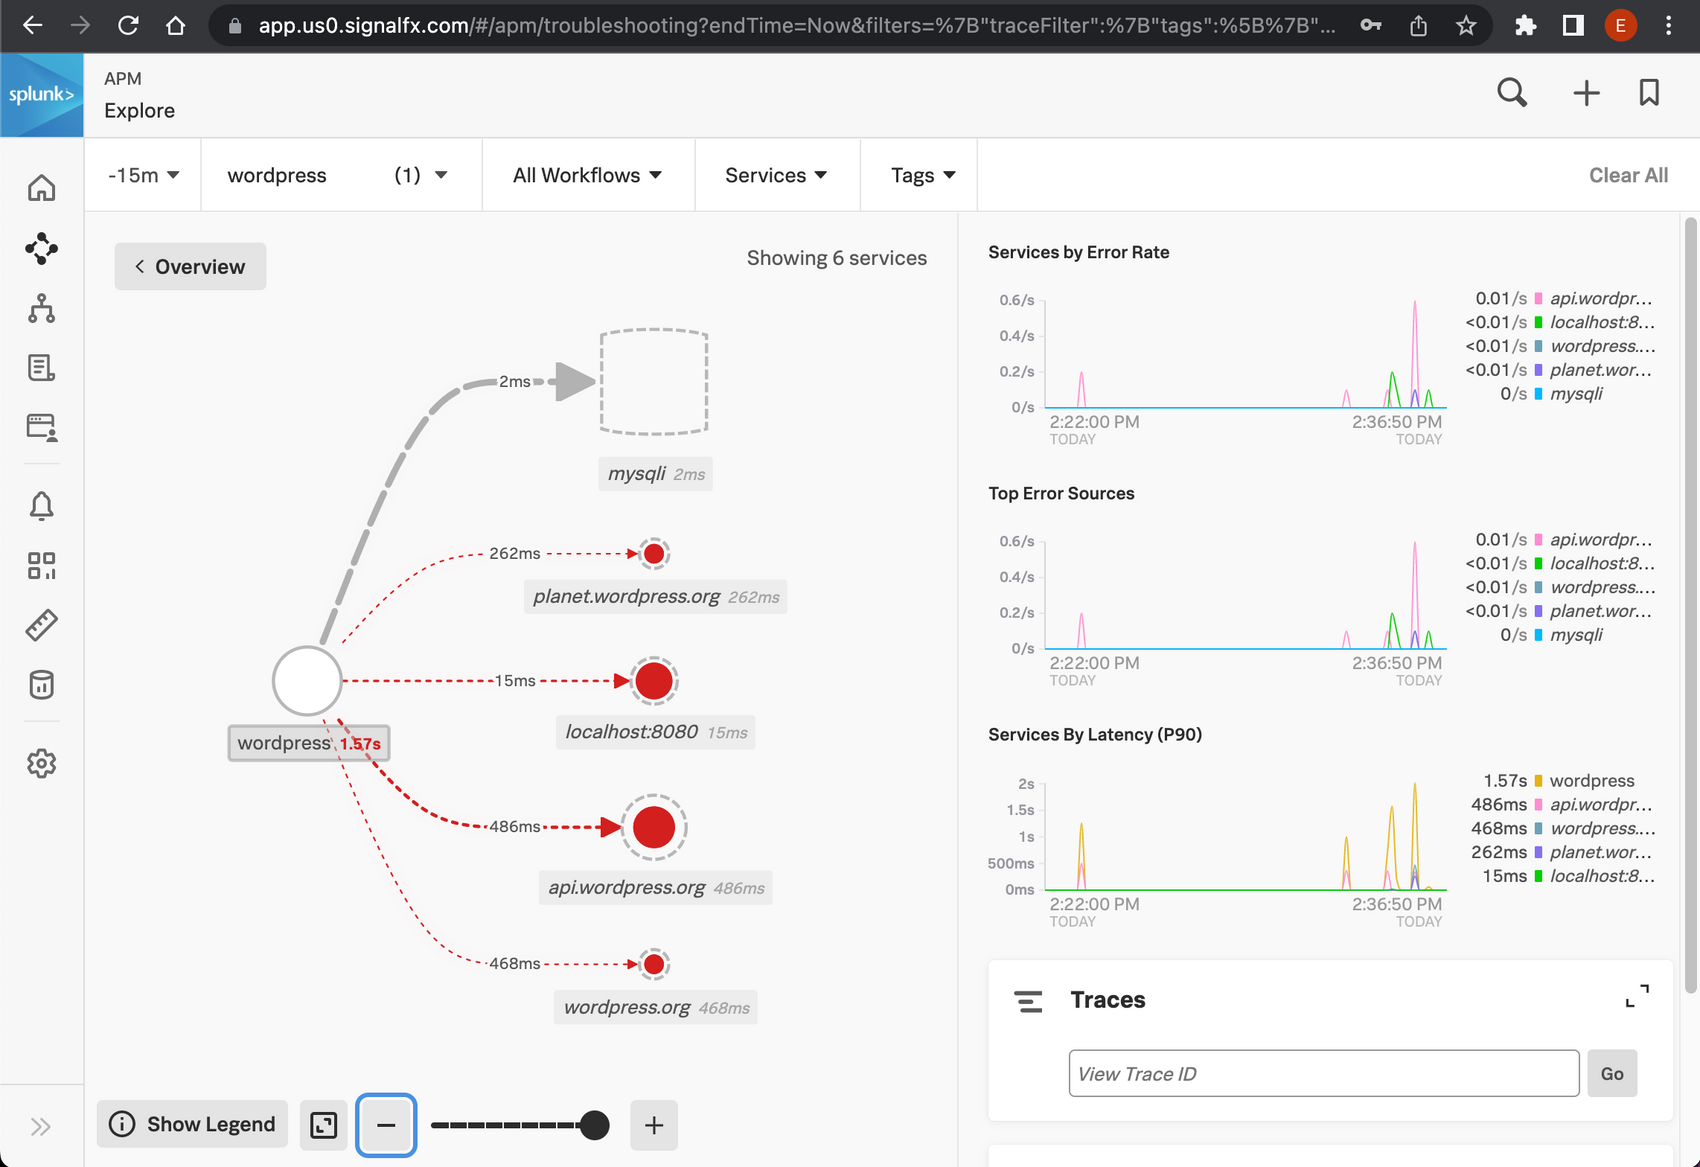
While we browse around the wordpress site. We are already sending traces. Check in APM to see what we've already got:
And we are also getting metrics from the host running our containers:

Refine our collector config
Traces
Break down by URL
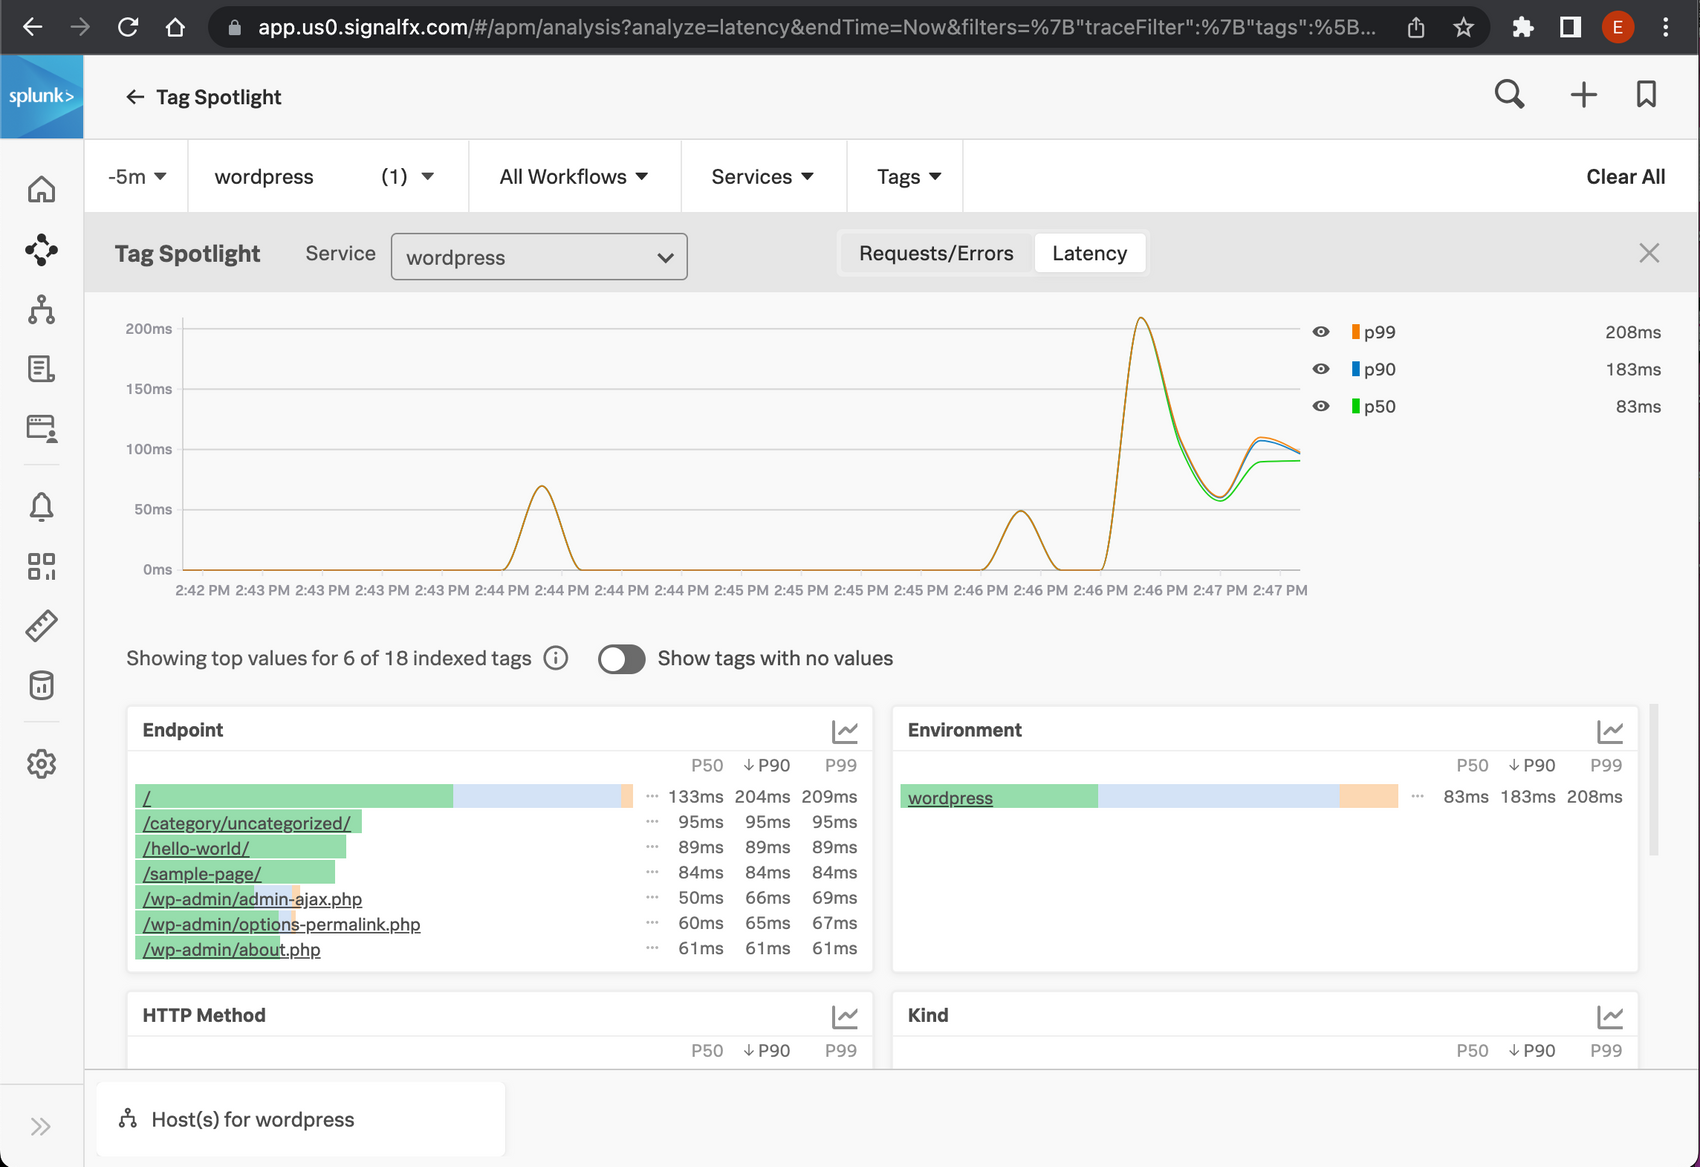
We already get quite some insight into our monolith. But wouldn't it be nice if we can break down performance by URL? We already have got that data, the visited URLs are added to the traces as the attribute http.url.
We can configure Splunk APM to add a break-down for this attribute. https://help.splunk.com/en/splunk-observability-cloud/monitor-application-performance/analyze-services-with-span-tags-and-metricsets/learn-about-monitoring-metricsets/create-a-monitoring-metricset-with-custom-dimensions.
In this case, I don't want to change anything in our APM configuration, so I will solve it in the collector configuration. The OpenTelemetry collector has very powerful features to manipulate data. In this case, we need to change the span name to the contents of the attribute http.url. We add the following processor:
  span/endpoint:
    name:
      from_attributes: [http.url]
And add the processor to the traces service:
    traces:
      receivers:
        - zipkin
      processors:
        - memory_limiter
        - batch
        - resourcedetection
        - resource/add_environment
        - span/endpoint
      exporters:
        - sapm
        - signalfx
Now we can inspect our performance by URL:
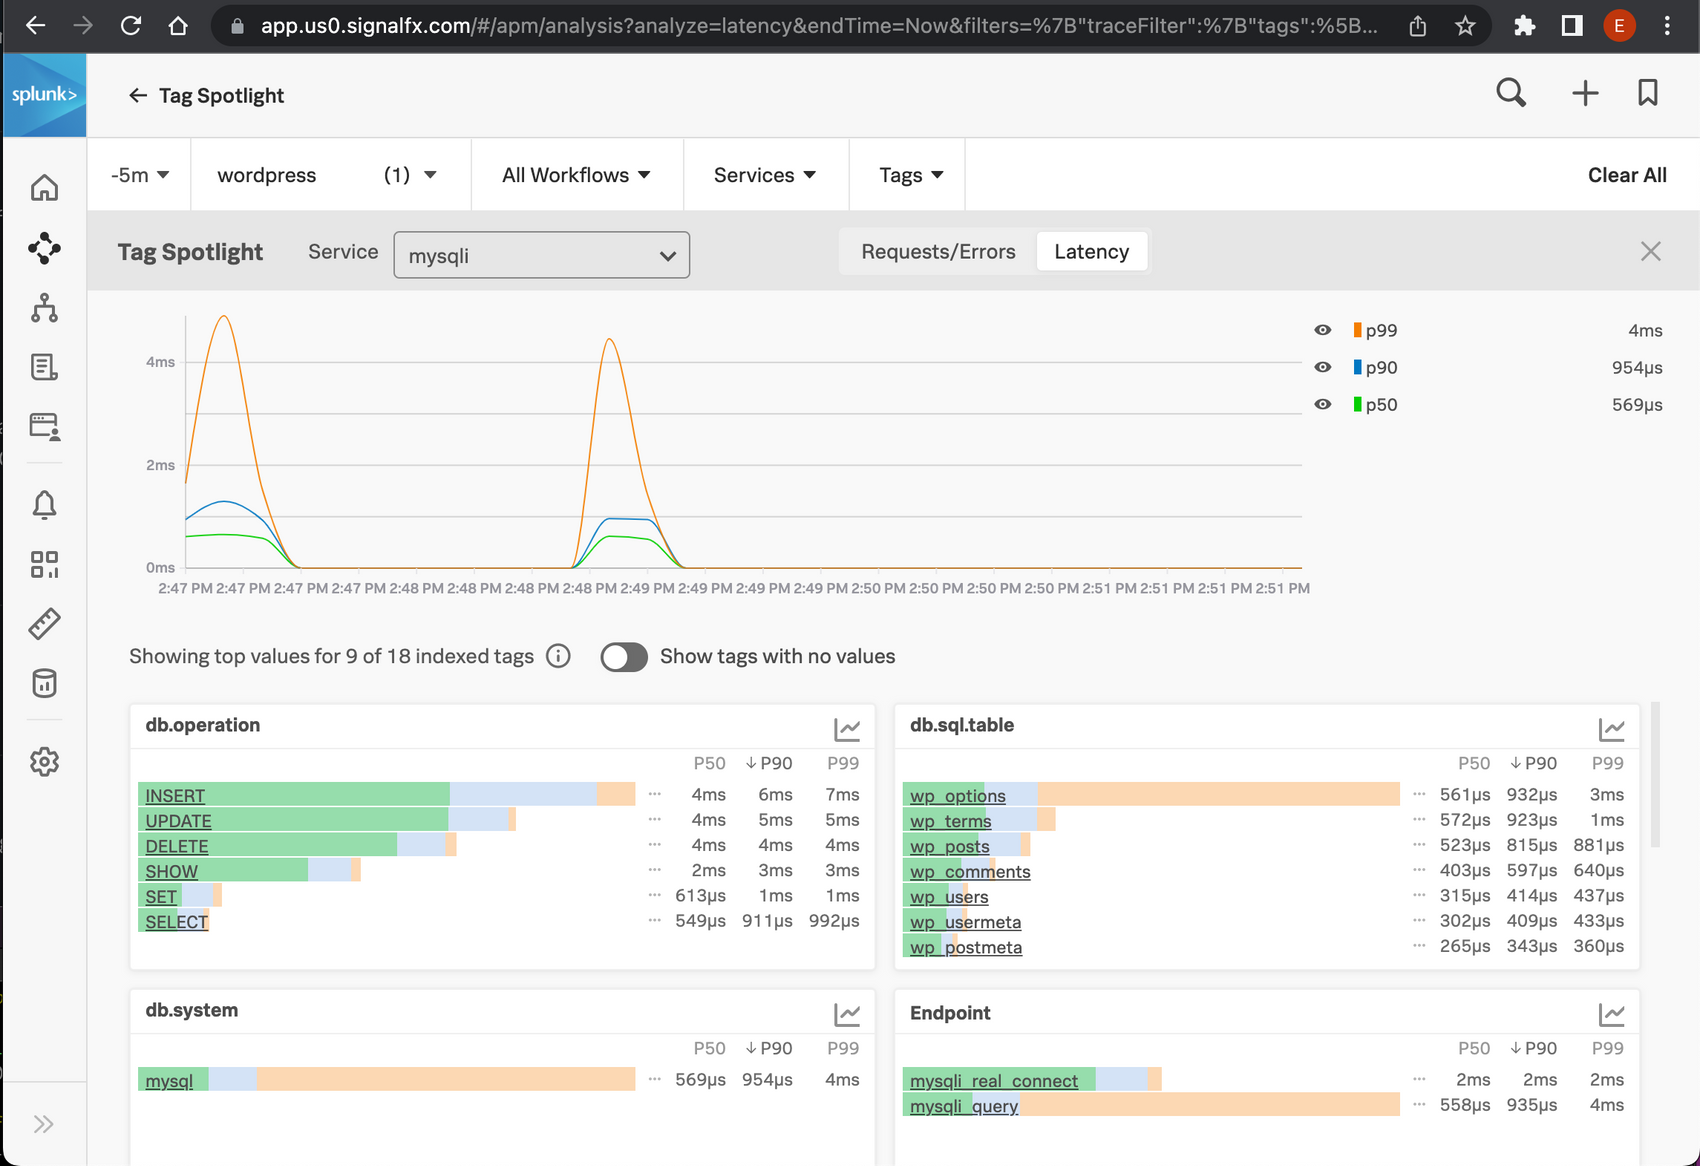
Break down by database operation or table.
In the trace view you might already have seen we collect all sql queries. Wouldn't it be great if we can also break down our performance by database table, or operation?
To do this we again use the processing capabilities of the open telemetry processors. This time it is a bit more complicated, as we need to extract the operation and database table from the query, and put it into a new attribute.
We extract the db operation using this regex: (?ms)(?P<dboperation>\w+). This is a very naive regex to simply get the first word of the query. Which works surprisingly well.
Extracting the tables is a bit trickier when JOIN's are involved. For the sake of simplicity I only extract the base table, and exclude any table joined to it for now. The regex to grab the word after FROM is (?ms).*FROM\s?'(?P<dbtable>[^\s']+).
These regexes use named capturing groups to extract data. dboperation and dbtable. The attributes we need are named db.operation and db.sql.table. Unfortunately regex does not support a dot in the name of a capturing group. So we need to rename the extracted attribute.
Renaming attributes in the OpenTelemetry collector is done in two steps. Duplicate the attribute to the new name. And delete the original attribute.
This brings us to the following configuration:
  attributes/db:
    include:
      match_type: strict
      attributes:
        - key: component
          value: mysqli
    actions:
      - key: resource.name
        pattern: (?ms)(?P\w+)
        action: extract
      - key: db.operation
        from_attribute: dboperation
        action: insert
      - key: dboperation
        action: delete
      - key: resource.name
        pattern: (?ms).*FROM\s`?(?P[^\s`]+)
        action: extract
      - key: db.sql.table
        from_attribute: dbtable
        action: insert
      - key: dbtable
        action: delete
You see the extract, insert, delete action twice. For both the table and operation. At the top you see we restrict these transformations to traces that have the attribute component set to mysqli. This way we are sure we only manipulate database-related traces.
We also need to add this processor to the traces service:
    traces:
      receivers:
        - zipkin
      processors:
        - memory_limiter
        - batch
        - resourcedetection
        - resource/add_environment
        - attributes/db
        - span/endpoint
      exporters:
        - sapm
        - signalfx
Restarting the OpenTelemetry collector will show we now have nice database breakdowns available:
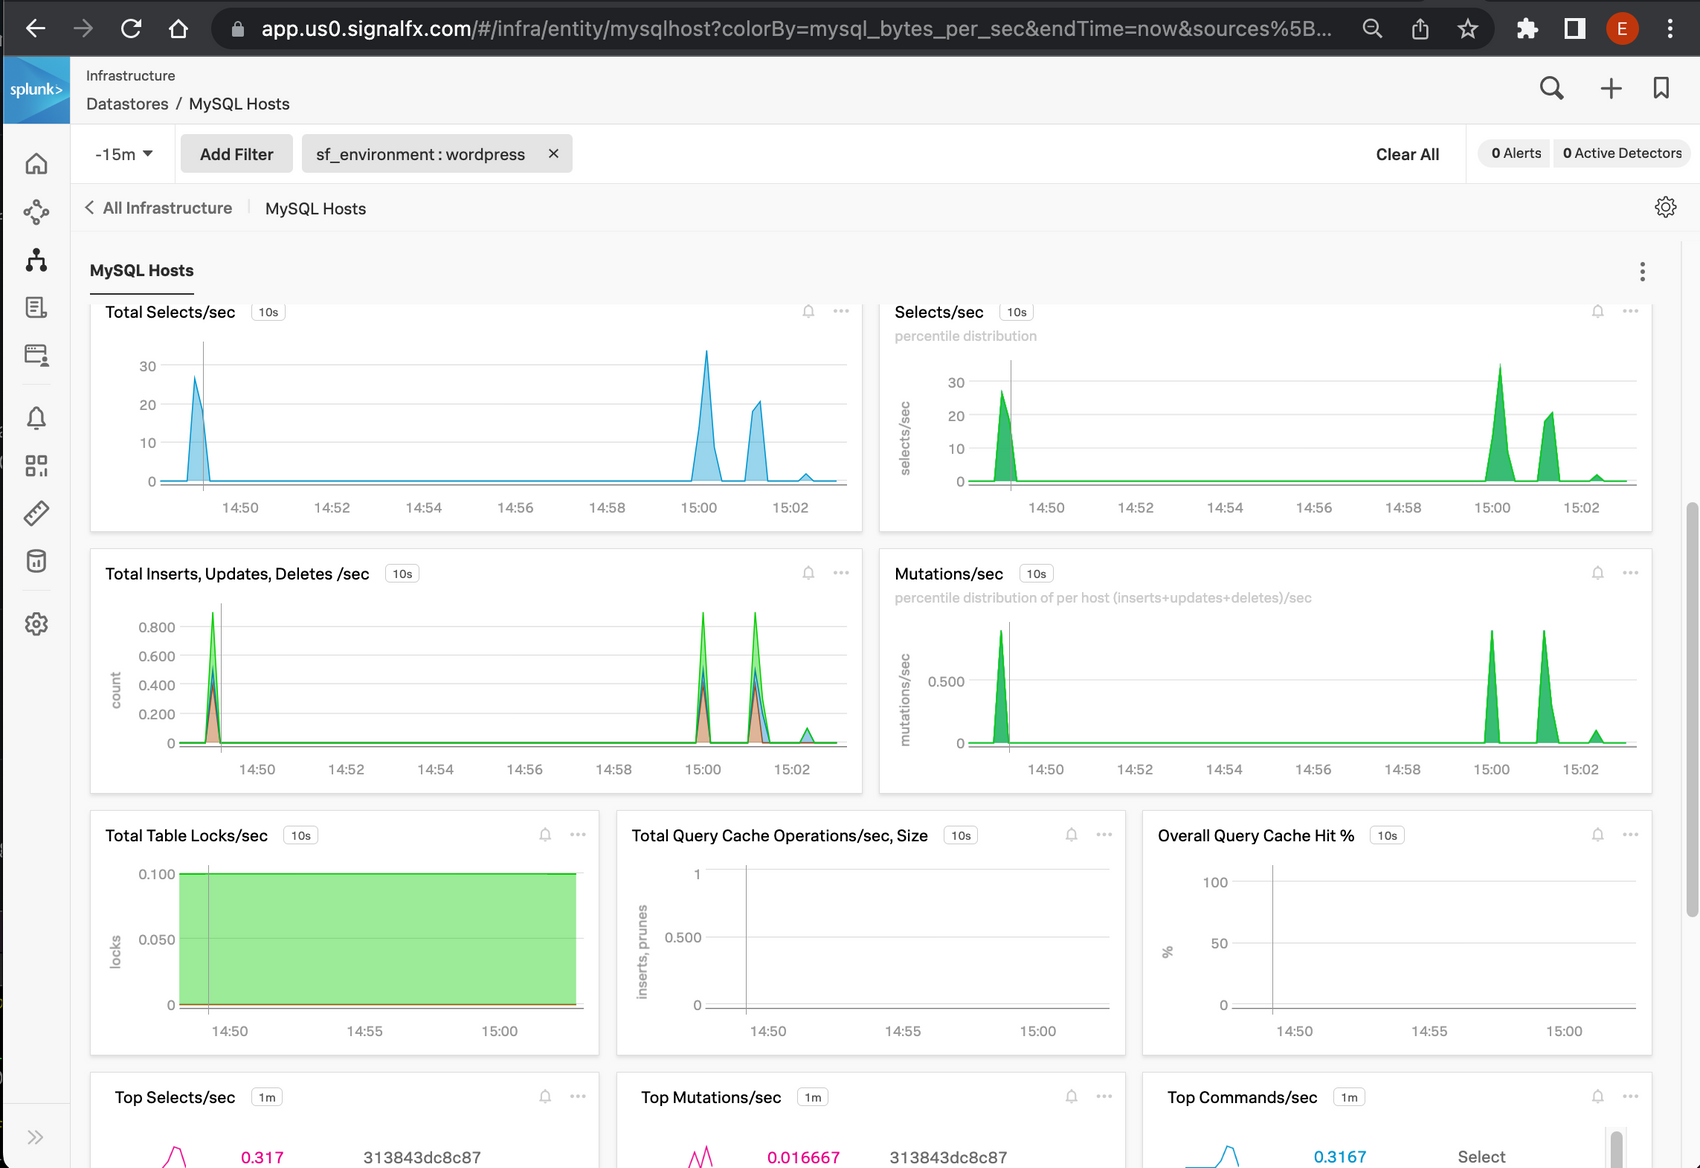
Mysql metrics
Now that we have quite some insight into what WordPress and the database are doing, wouldn't it be nice to see some more details of our database?
We can get that by easily adding a receiver for MySQL to our collector config:
  smartagent/mysql:
    type: collectd/mysql
    host: db
    port: 3306
    databases:
      - name: wordpress
        username: ${MYSQL_USER}
        password: ${MYSQL_PASSWORD}
    extraDimensions:
      service.name: mysql-service
And add this receiver to our metrics pipeline service:
  pipelines:
    metrics:
      receivers:
        - hostmetrics
        - smartagent/mysql
This makes the default MySQL dashboard light up:
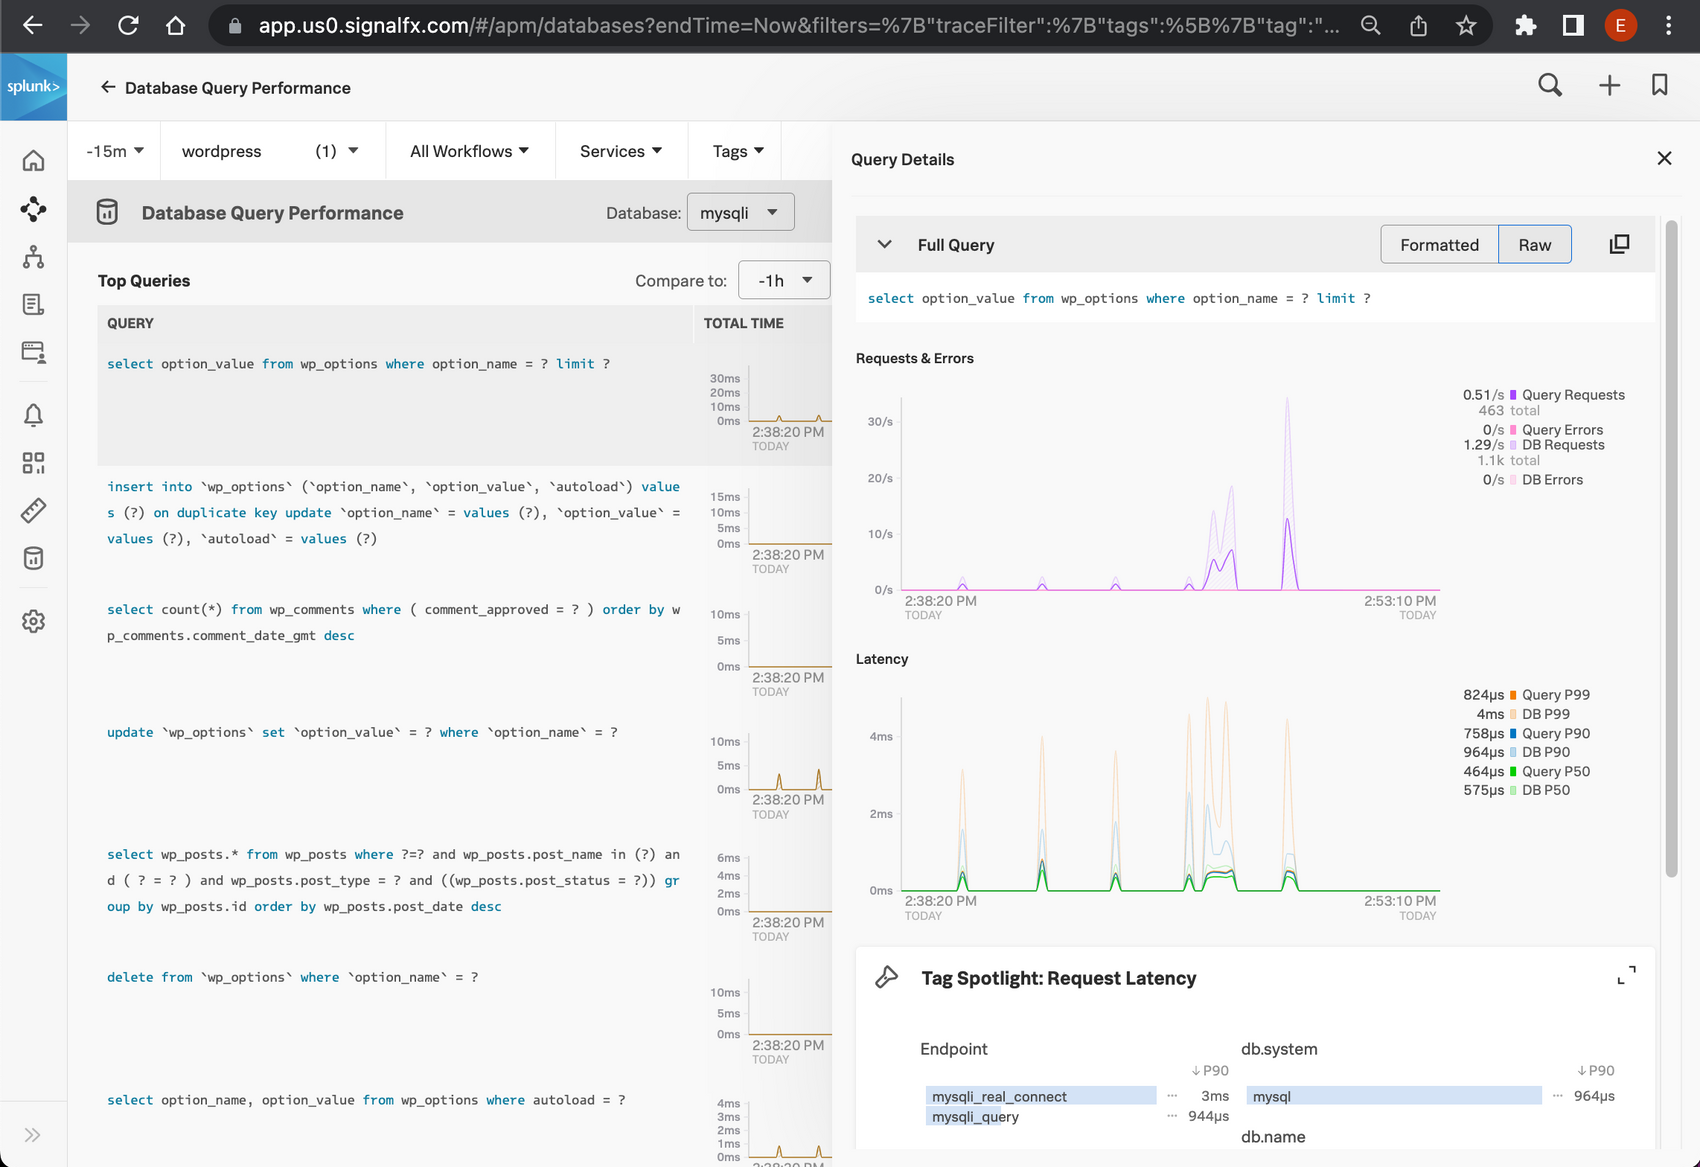
Final result
Now we have fully instrumented our WordPress monolith with modern tooling, without any changes to the WordPress application itself!
Amongst other things, we can see latency per URL, inspect slow queries, see which URLs map to which queries, and inspect our most important database and host metrics. Pretty impressive if you ask me!
Further improvements
All techniques mentioned in this article are done without any changes to the WordPress or template code. If needed we could of course go further. We could add our Real User Monitoring to the front end, so we get deep insight into how the pages render on the client devices. This could point us to performance problems and bugs in the javascript and CSS used by the WordPress templates or posts.
To further instrument the backend we can add manual tracing statements to our WordPress plugins. This will show us in great detail which plugin contributes how much to the total back end loading time.
This article was originally written for and published as a Splunk Community Blog

I am Erwin Vrolijk. A technologist, living in Dordrecht, The Netherlands, with a varied talent stack. I help people to be more effective based on data. Learn more about me.